I've been running Google Ads at AppSumo for nine years. For most of that time, I chased data across dashboards, waited on BI teams for reports, and trusted Google's numbers because I didn't have a better option.
In the last six months, I replaced almost all of that with two things: an n8n workflow that runs daily and a Google Ads MCP connected to Claude Code. Now I wake up to a Slack message that tells me exactly what happened, what broke, and what to do about it.
This is the exact system I built. The whole thing.
Why You Can't Trust Google's Numbers Alone
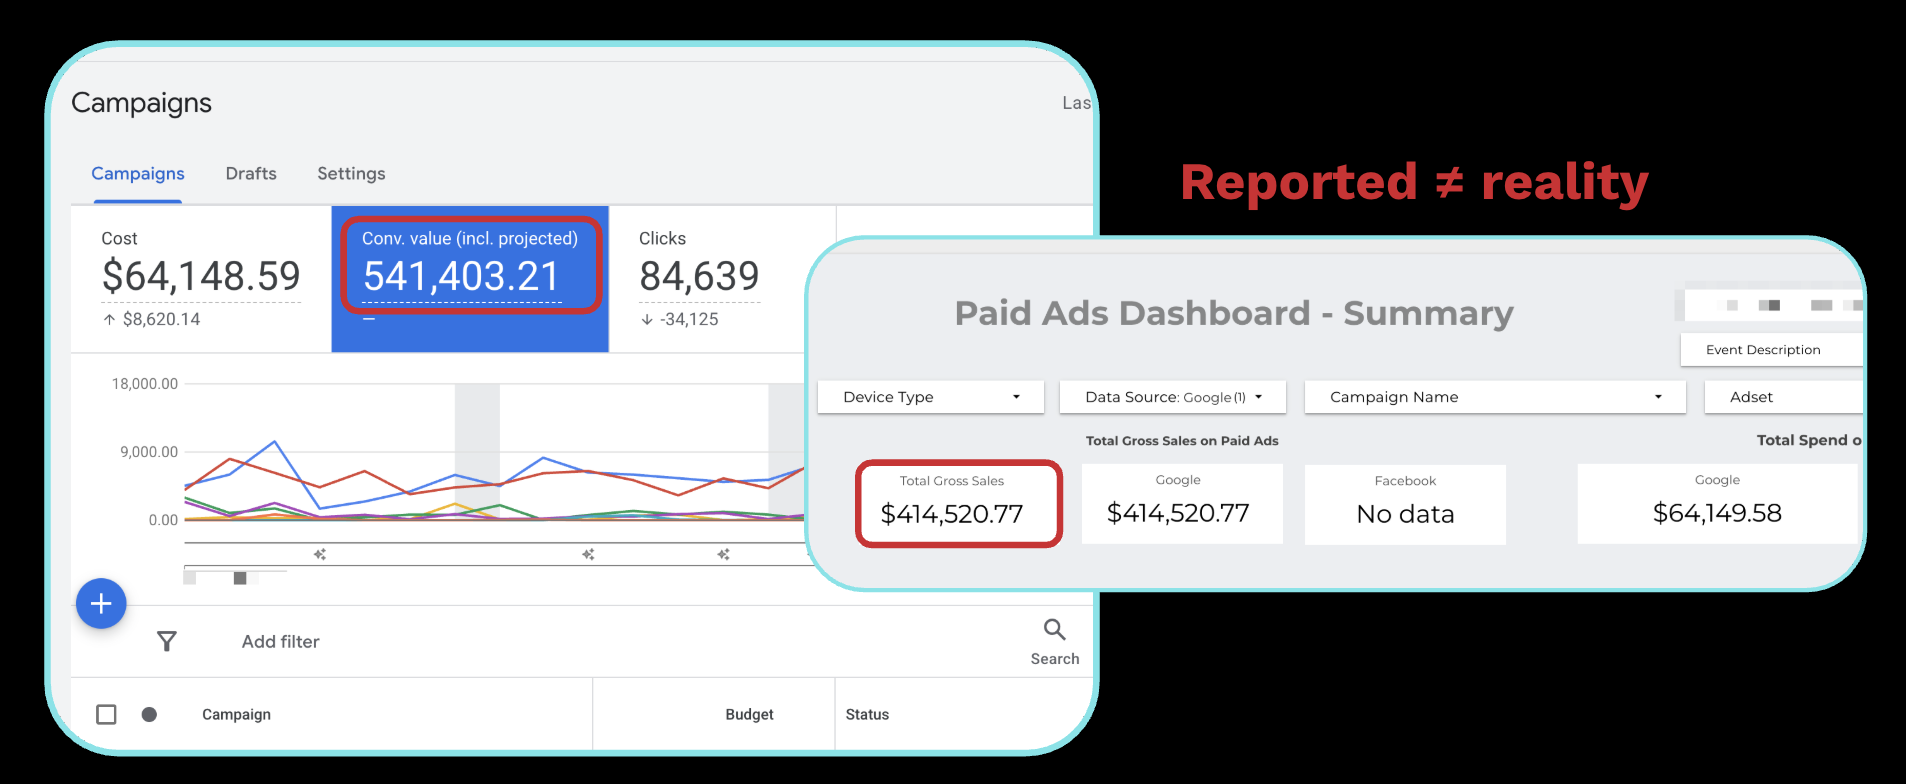
Here's a real example from AppSumo. Same time period, same campaigns:
- Google Ads reported: $541K conversion value on $64K spend
- Our internal data: $420K on the same $64K spend
That's over $120K in difference. Same spend on both sides.
Why? Google uses long attribution windows with a mix of view-through and click-through attribution. If someone sees your ad, doesn't click it, then buys three weeks later, Google takes credit. That inflates ROAS and makes campaigns look better than they are.
The bigger problem is cannibalization. Google Search is bottom-of-funnel. Someone Googling your brand name was probably coming to buy anyway. If you're bidding aggressively on brand terms, Google is claiming credit for traffic that email, organic, or direct would've captured.
ROAS in Google Ads is not profit. Your business runs on profit.
The Financial Truth Layer
I don't trust any single source of data. Not Google. Not our own internal metrics. Not third-party analytics.
Instead, I pull from all of them, merge the data together, and let the full picture drive decisions.
The core metrics I track:
- Spend, from Google Ads API
- Gross profit, from our internal database (Snowflake to Looker), tracked via UTMs back to specific campaigns
- Profit-to-spend ratio, the marriage of the two. Our goal is 1.5:1 for Google (Meta is 0.5:1 because it's more top-of-funnel)
- CAC to LTV, customer acquisition cost against lifetime value in profit (not revenue). We target breakeven in three months
Profit-to-spend ratio is my daily metric. If it drops below 1.5, something's wrong and I investigate immediately.
CAC to LTV is the long game metric. If it cost $100 to acquire a customer, I need $100 in profit back within three months. Not revenue. Profit, after refunds, chargebacks, COGS, and partner payouts.
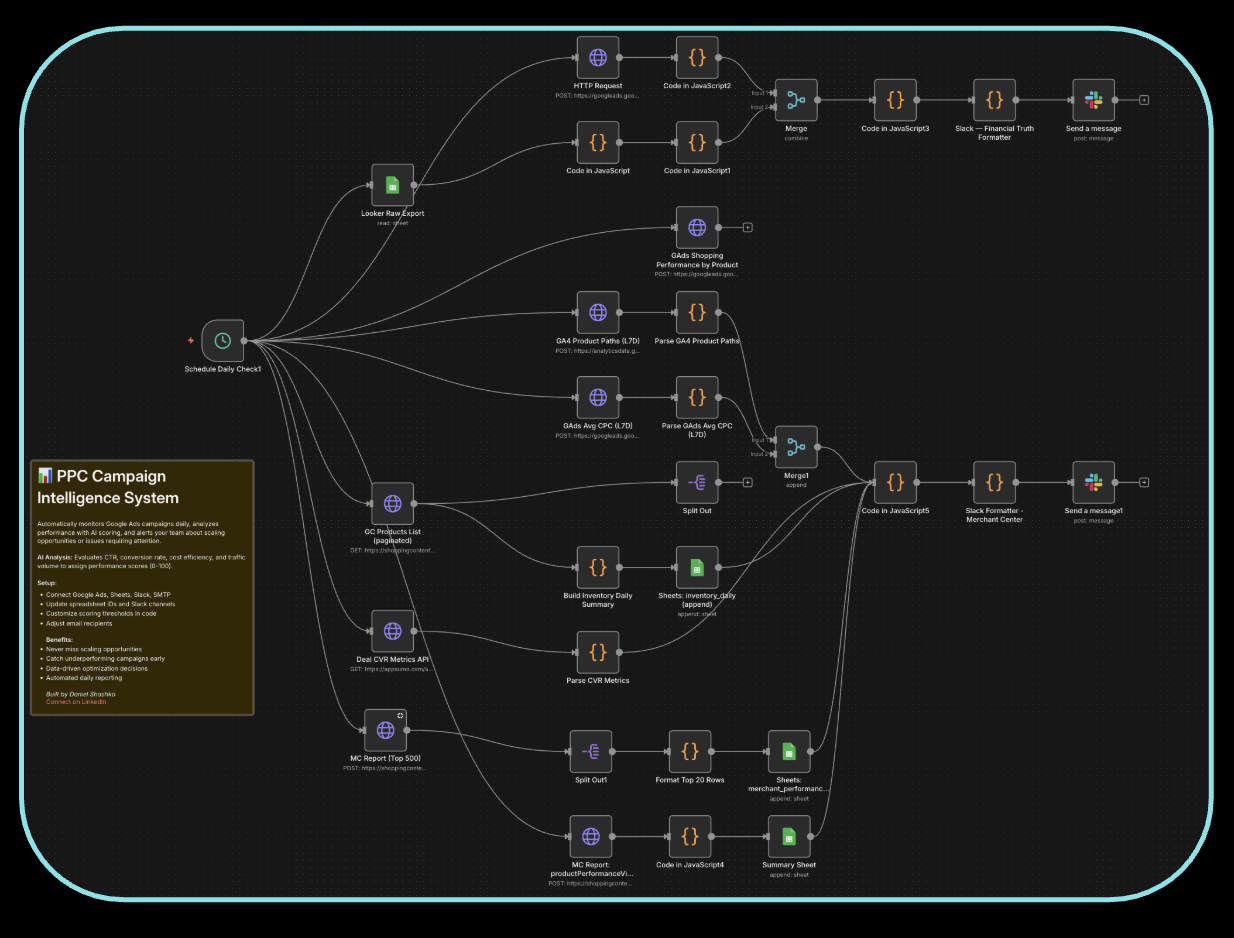
The n8n Workflow: How It's Built
The workflow runs daily. Here's the architecture:
Data Sources
- Google Ads API: spend, conversion data, campaign performance, change history
- Looker/Snowflake: first-party profit data, gross sales, UTM-matched revenue
- Google Merchant Center: product-level click and impression data (critical for ecommerce with a product catalog)
- Google Sheets: any supplemental data or manual inputs
Getting Google Ads API Access
You need to apply for Basic Access through your Google MCC (Manager Account), which is separate from your regular Google Ads account. You start with Explorer access, then apply for Basic. The application is straightforward; you can have an LLM help you fill it out. Basic access gives you everything: campaign data, keyword data, and most importantly, change history.
The Pipeline
- Schedule trigger: runs daily (you could run it hourly if your spend warrants it)
- Fetch nodes: pull data from Google Ads API, Looker exports, Merchant Center
- Merge node: n8n's combine/merge node joins all datasets together. This used to require an entire ETL pipeline and a BI team. Now it's one node.
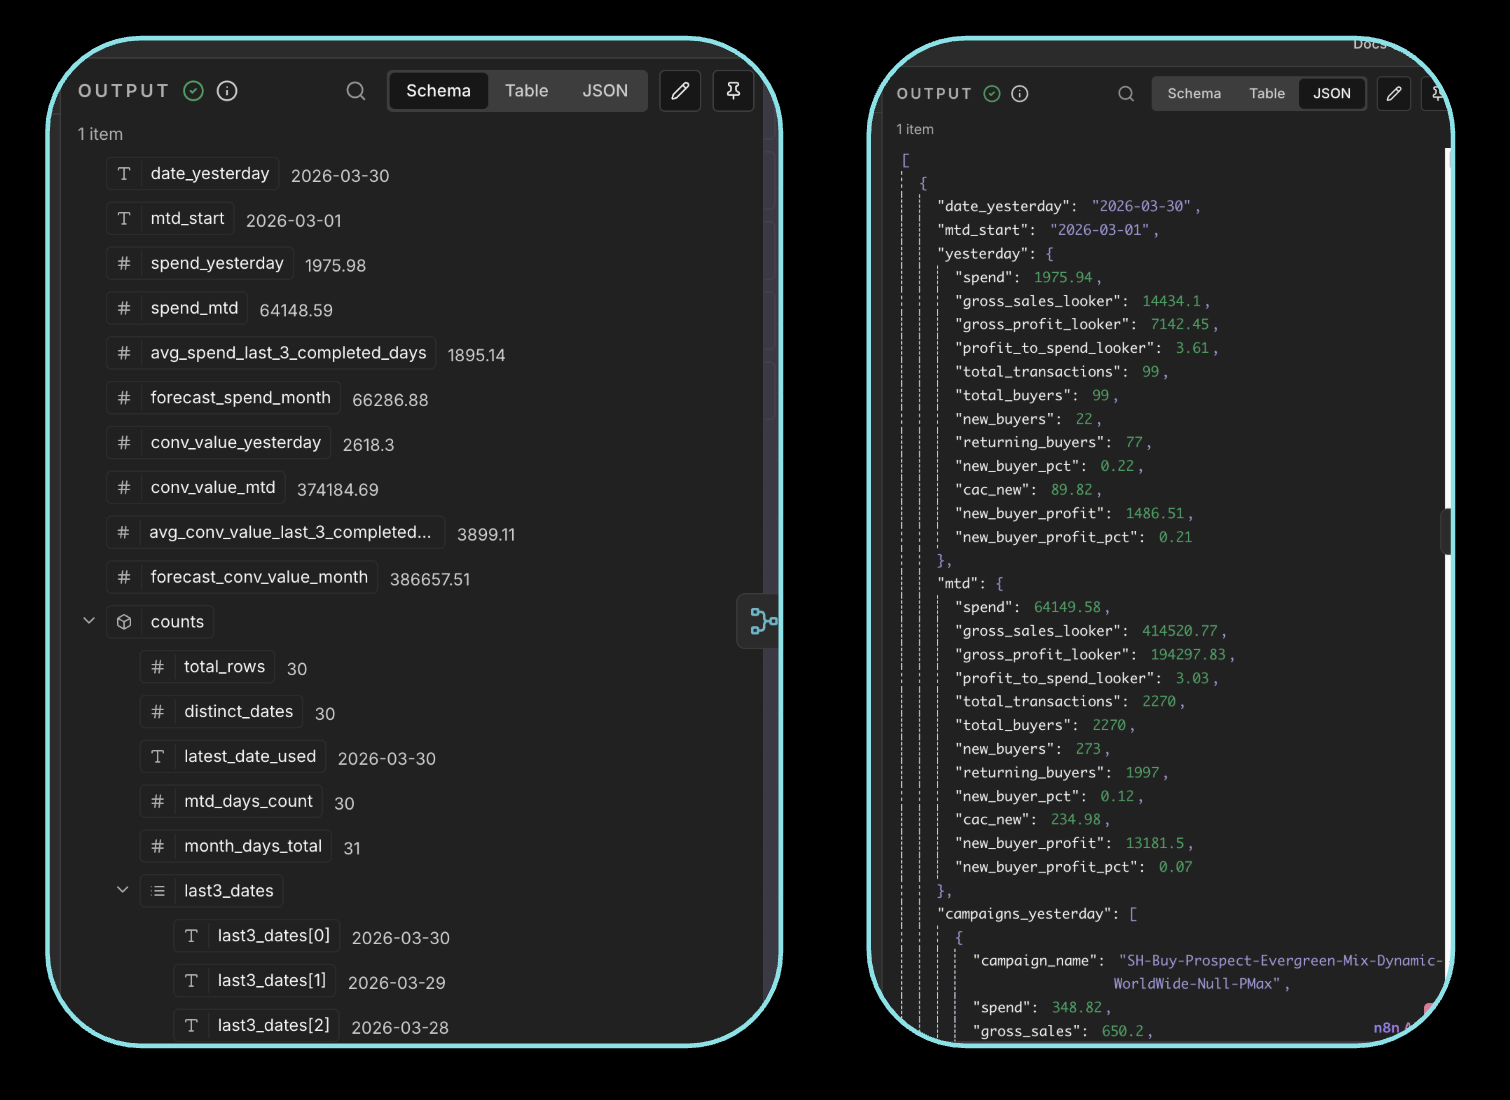
- AI layer: an LLM node normalizes the data, calculates derived metrics, and generates insights. I use Claude (Sonnet) for this.
- Output to Slack: daily messages with everything I need to make decisions
What I Get in Slack Every Day
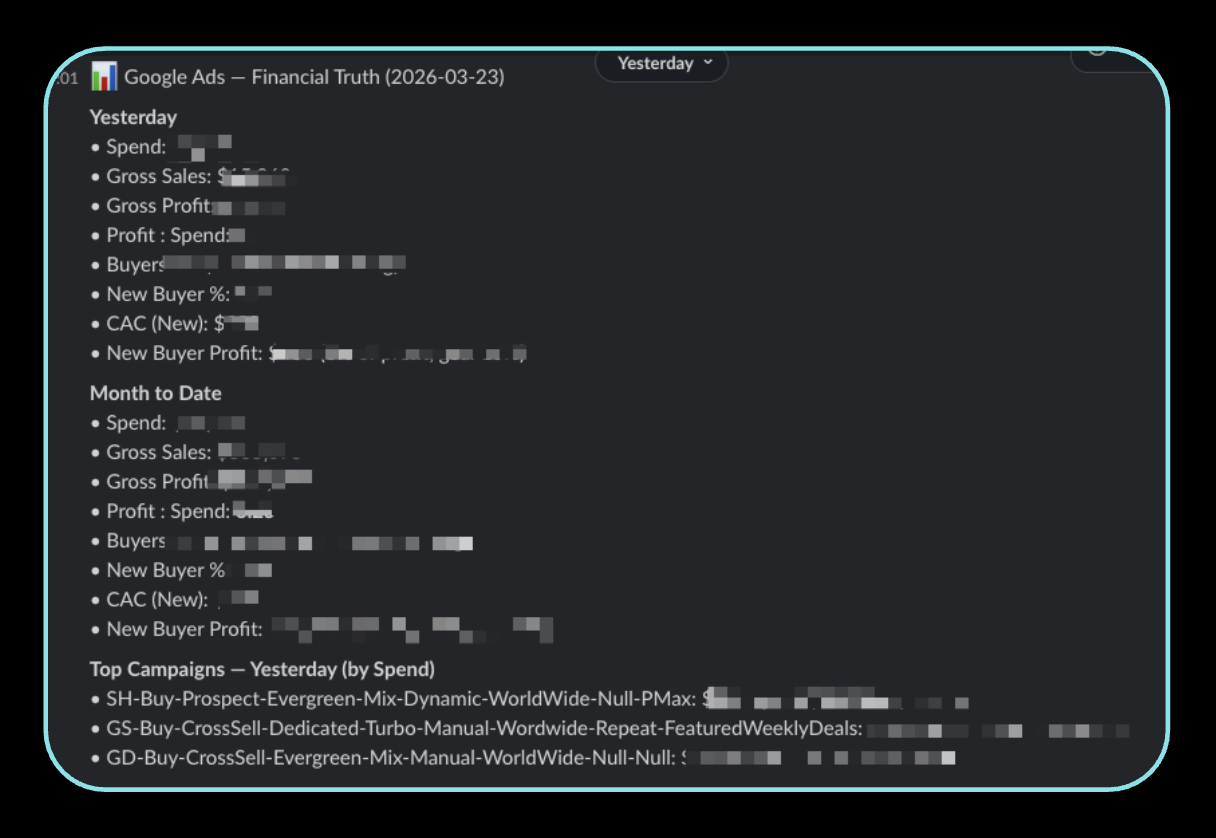
Message 1: Top-line metrics
- Spend, sales, profit, profit-to-spend ratio (with goal comparison)
- Acquisition cost
- Month-to-date same metrics
- Top campaigns by spend
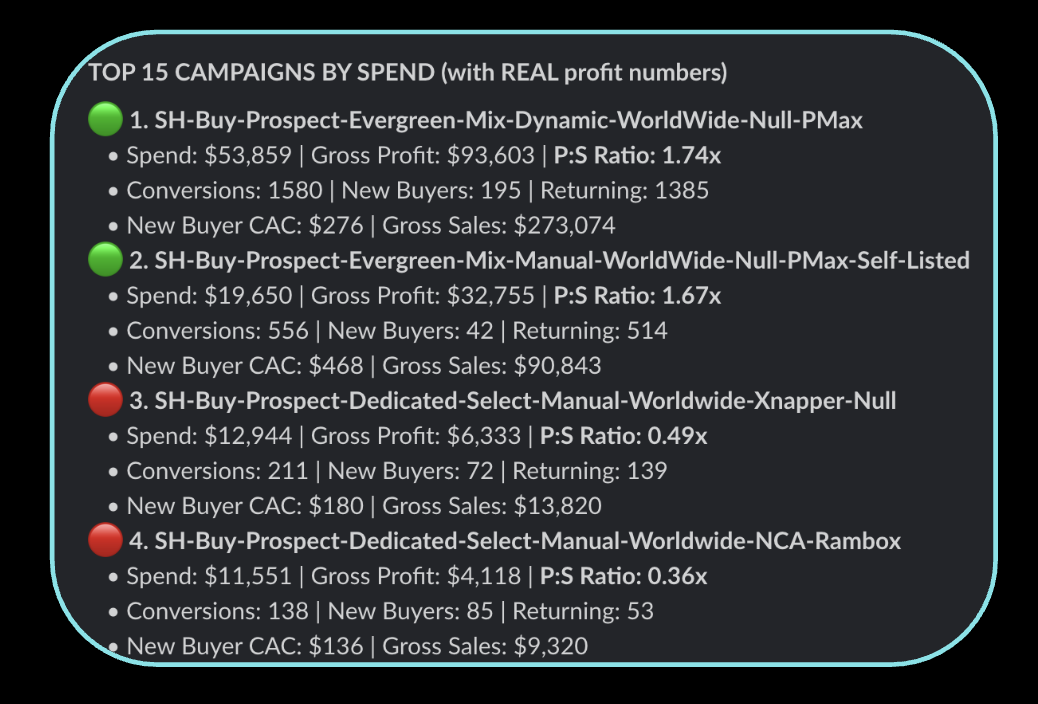
Message 2: Campaign grades Each campaign gets a green/red flag based on profit-to-spend ratio:
- Above 1.5 → green, spend more
- Below 1.5 → red, investigate or pause
Message 3: Campaign ranking by real profit
Message 4: Deal/product performance Pulled from Merchant Center + Looker. Shows conversion rate by product:
- High conversion rate + low spend = underfunded, increase budget
- Low conversion rate + high spend = overfunded, pull back
Message 5: Agency change log + grade This is the one people lose their minds over. With Basic API access, you can pull every change your agency (or team) makes from Google Ads change history. Every keyword added, every bid change, every strategy shift. It's all logged.
My AI layer grades each change against business results. What the agency did. What my agent would have done. And a performance score.
It's like having a second opinion on your mechanic, every single day.
Sometimes the agent is right. Sometimes I look at it and say, "No, we did this for a strategic reason you don't understand." But having that daily accountability layer changes the dynamic completely.
Message 6: Anomaly detection Threshold-based alerts that fire independently:
- Spend above X at this time of day → something might be wrong
- Spend below expected at 2pm → campaigns might be paused or limited
- CPA spike beyond 2x average → immediate flag
Google Ads MCP: The Executive Layer
The n8n workflow handles daily operations. For the weekly executive view, I use the Google Ads MCP with Claude Code.
This is a connector that lets Claude Code query your Google Ads account directly. I got the initial setup from the head of growth at Anthropic and built on top of it.
What It Does
Every week, Claude Code generates a full performance report:
- Week-over-week trends across all campaigns
- Actual ad creative performance (which ads are working)
- Recommended actions with reasoning
- Budget reallocation suggestions
How It's Different From n8n
- n8n = daily tactical decisions (spend more here, pause that, investigate this anomaly)
- Google Ads MCP = weekly strategic review (how's the portfolio doing, what should we shift)
There's overlap, and honestly you might only need one. But I use both because they serve different decision speeds.
Setting It Up
- Download Claude Code (the desktop app, not browser)
- Get your Google Ads API credentials (same Basic Access from earlier)
- Configure the MCP connector (Claude Code can walk you through this)
- Build a skills file that defines your metrics, goals, and reporting format
- Run it weekly (or whenever you need an executive summary)
The skills file is where the magic lives. It's how you train the agent to understand YOUR business metrics, YOUR goals, and YOUR definition of success. Without it, you get generic recommendations. With it, you get recommendations specific to your profit targets and channel strategy.
Building These Workflows With AI
Most people don't realize this: I didn't hand-code most of this.
I described the problem to Claude Code. Told it what data sources I had, what metrics I cared about, and where I wanted the output. It built the n8n workflow. I also used OpenClaw for some of it.
But here's the critical part: don't ship 100% of what the agent builds.
Go into the workflow. Understand what each node does. Verify the data transformations are correct. The agent gets you 80% of the way there in minutes. The last 20% is you understanding it well enough to debug when something breaks. And it will break.
This is true for n8n workflows, for code, for anything agents build. Use them to move fast, then verify.
What AI Agents Can't Do Yet (The Honest Limitations)
I'd be lying if I said agents can run your Google Ads for you. They can't. Here's what they're bad at:
1. Strategic context
The agent doesn't know that you're investing heavily in a campaign with low ROAS because you're launching a new product category. It doesn't know about the partnership deal that changes your margin. It sees numbers. You see strategy.
2. Cross-channel thinking
My n8n workflow pulls from Google Ads and Looker. But it doesn't know that the Meta team just launched a big awareness campaign that's about to flood Google brand search with new traffic. Agents optimize in silos unless you explicitly wire them together.
3. Creative judgment
Agents can tell you which ads are performing. They can't tell you why the creative works or what to test next. Performance marketing is art and science. The data is the science. The intuition about what message will resonate with your audience is still you.
4. Business model nuance
My agent doesn't understand that AppSumo deals are only live for 60 days, that conversion rate varies wildly by deal category, or that Q4 spending patterns look nothing like Q1. You have to encode that context into your prompts and skills files, and even then it's imperfect.
5. Trust calibration
The agent will confidently tell you to pause a campaign that's "underperforming." But maybe it's underperforming because you just changed the landing page two days ago and need more data. Agents don't know when to wait. They always want to act.
The real role of AI agents in paid media today: they're the best analysts you've ever had. They process data faster than any human, surface patterns you'd miss, and automate the boring reporting work. But you make the decisions.
How to Get Started in the Next 60 Seconds
Here's the fastest path:
- Download Claude Code (desktop app)
- Get your Google Ads API token from your MCC
- Open Claude Code and describe your problem. Something like: "I want to build an n8n workflow that pulls my Google Ads spend data daily and sends me a Slack summary with campaign performance."
- Give it API access (store tokens in 1Password or whatever vault you use)
- Let it build. Then go verify every node.
You don't need to write a single line of code. I'm not a technical person. The agent handles the wiring. Your job is to define what metrics matter, verify the output, and make decisions from it.
At any spend level, $100/day or $100,000/day, this is relevant. It's real money, you can't get it back, and you should know exactly where it's going every single day.
Let the data come to you instead of chasing dashboards.